


April 15, 2026
By Braden Eberhard
Offseason movement usually gets framed around names. This year a lot of the talk revolved around Alex Atkins and Daan De Marrée in New York, Thomas Edmonds in Boston, Lukas Ambrose and Noah Coolman in Minnesota. But these names are only part of the story and another facet that matters just as much is the kind of value that moved.
INTRODUCTION TO SHOWN SPACE ADVANCED STATS
That’s what this piece tries to do using Shown Space metrics. The core stat is aEC (Adjusted Expected Contribution). It uses a machine learning model to estimate how much a player’s actions changed their team’s expected scoring probability on each play, and accumulates that across a season. Also called “Contribution”, it is normalized so that 1.0 is roughly equivalent to one scoring possession, making it possible to compare players across different roles. so if Walker Frankenberg finished the season with 80.7 aEC, the total of his throws and receptions gave his team over 80 points worth of value!
Stemming from aEC we get 3 additional terms.
-
T-aEC: throwing contribution, value generated with throws
-
R-aEC: receiving contribution, value generated by getting open and moving the disc downfield through catches
-
LC: lag contribution, which captures the connective value of actions that improve the next play in a sequence. Think of it as credit for setting up the conditions that make the following throw more valuable.
In the context of roster changes, a team can add the same total contribution through very different combinations of these components. Adding throwing value tends to mean adding players who can initiate and control possessions. Adding receiving value tends to mean adding players who can extend and finish them. Adding LC tends to mean adding players whose impact shows up in how fluidly the offense moves between those moments.
A note on the defensive numbers: D-line players get fewer possessions and fewer offensive opportunities after turns than O-line players do, which makes raw season totals unreliable for comparison. Instead, the defensive tables use per-100-possession rates: how much value those players generated each time they had a break chance, rather than how much they accumulated over a full season.
Team-By-Team Gains And Losses
The four tables below break down every team’s O-line and D-line movement.
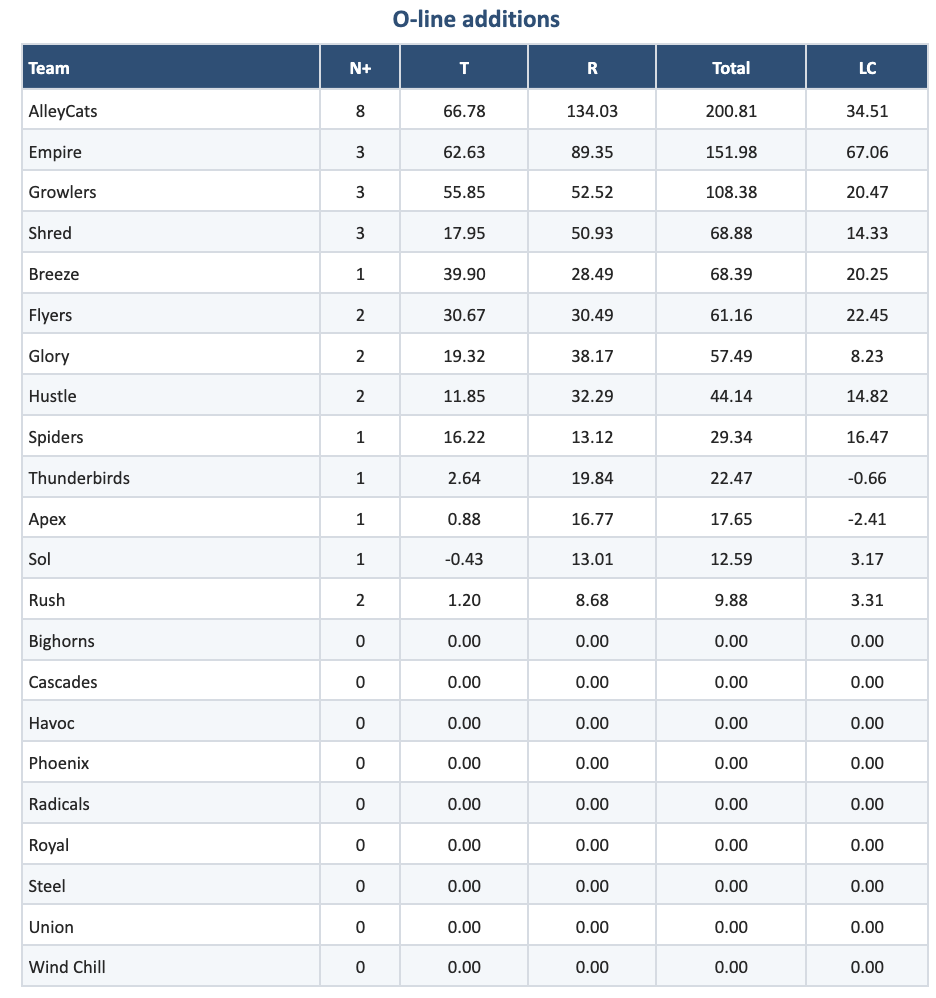
Offensive additions
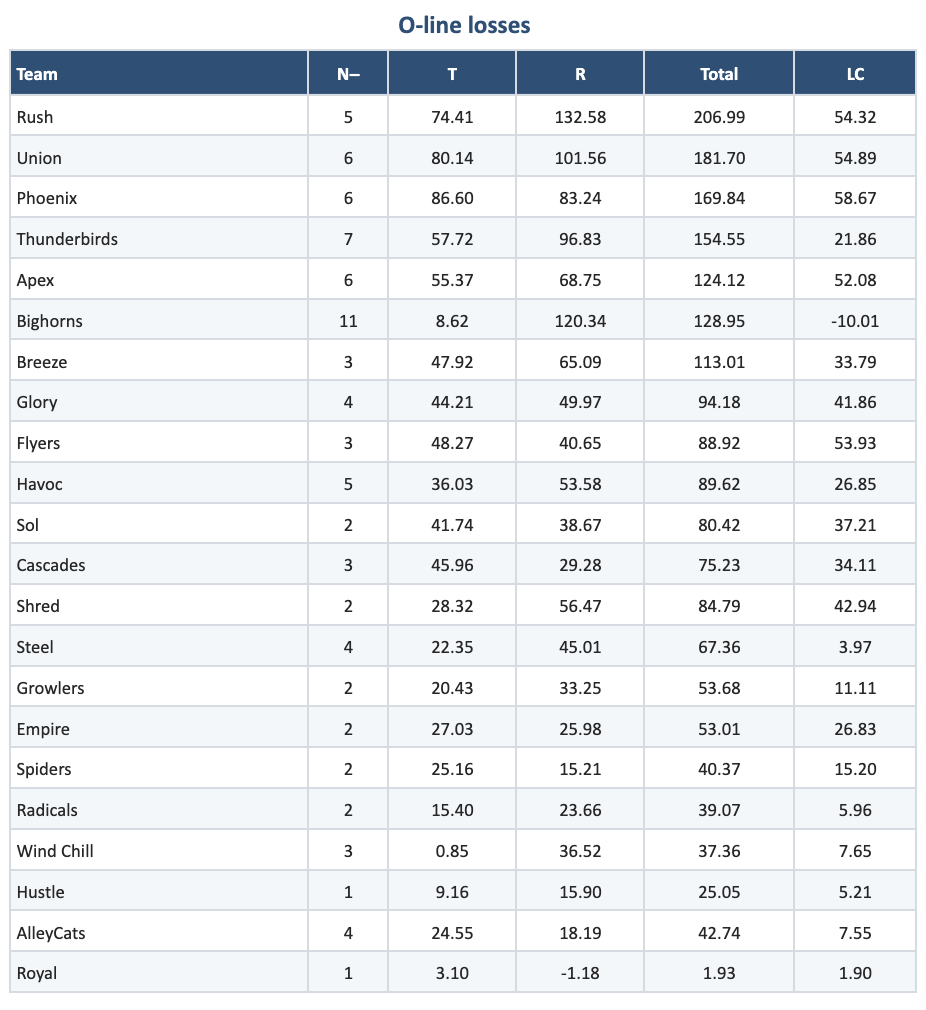
 Offensive losses
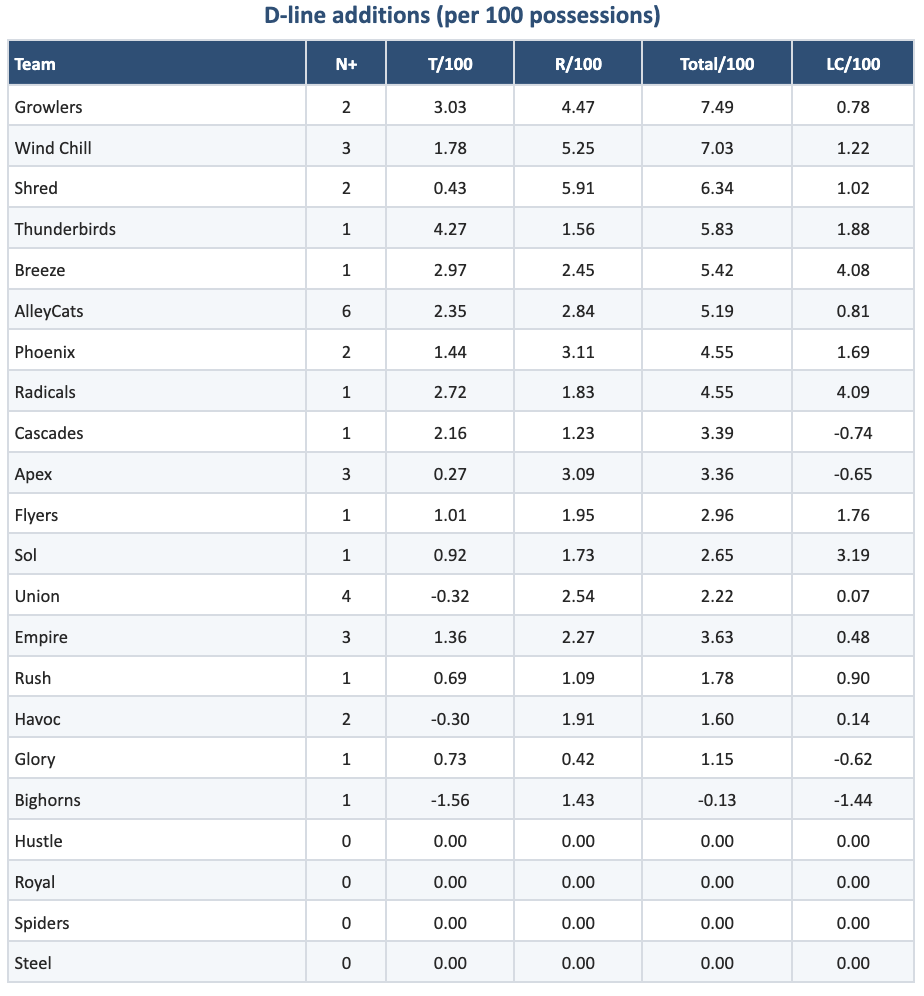
 D-line changes are shown per 100 possessions to make defensive movement more comparable across roles.
Defensive additions
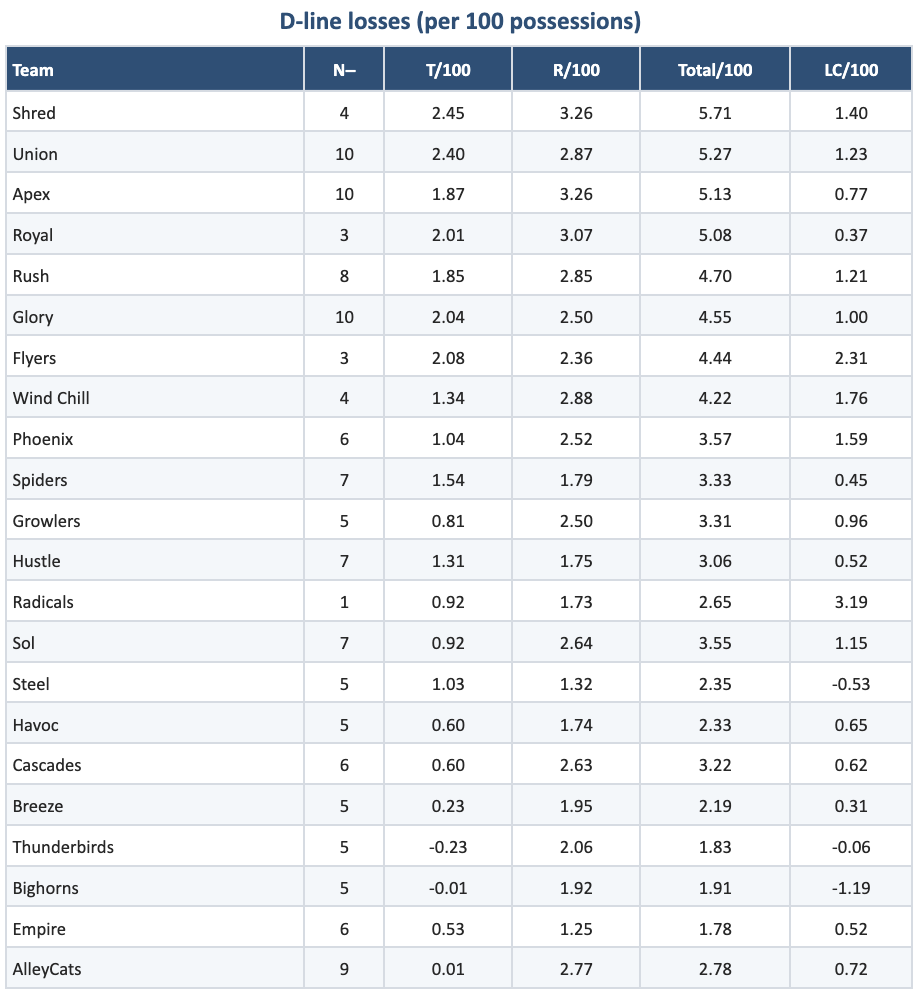
Defensive losses
Some teams added complete offensive value
The clearest examples here are Indianapolis and New York.
Indianapolis added 200.81 aEC in O-line players from 2025: 66.78 T-aEC, 134.03 R-aEC, and 34.51 LC. New York added 151.98, including 62.63 T-aEC, 89.35 R-aEC, and a league-best 67.06 LC. Both teams added offense in multiple forms, not just one dimension. Indianapolis looks like the broadest offensive upgrade, maybe even in the history of the UFA.
What makes this notable is both the breadth and depth of these numbers. While many teams concentrated their gains in one category, the empire and alleycats added value in connectors, throwers and receivers for big gains.
Some teams look stronger on both sides
San Diego hasn’t gotten the same attention as Indianapolis or New York, but the numbers still merit a closer look.
The Growlers added 108.38 O-line aEC, with strong numbers across both throwing and receiving, and they also added 7.49 D-line aEC per 100 possessions, the best defensive incoming mark in the league. That combination is relatively uncommon and likely stems from pieces arriving from the defunct Aviators.
Not all D-line turnover means the same thing
By reframing value by possession we can find insights into players who primarily played on defense last year.
Boston is a great example of broad defensive churn. The Glory lost 10 D-line players worth 4.55 aEC/100 and added back just 1.15. Regardless of the amount, that is a major turnover. Whether their younger players can step up is one of the more open questions heading into the season.
Carolina is a different situation. The Flyers lost only three D-line players, but those losses were worth 4.44 aEC/100 and 2.31 LC/100. The issue for the flyers isn’t volume; it’s concentration. The players no longer with them left a big hole equating to significant offensive value to be filled.
Some teams face a broad replacement burden
In this category, we have to single out Toronto.
The Rush lost 206.99 O-line aEC, the largest offensive loss in the league, including 132.58 R-aEC, also the largest receiving loss. They also lost 4.70 D-line aEC/100 and added back only 1.78.
Chicago and Philadelphia are in similar territory offensively. Chicago lost 181.70 O-line aEC and Philadelphia lost 169.84, both among the highest losses in the league. Neither added meaningfully to offset it.
These teams are facing more than a typical talent drain. They are trying to replace volume across multiple parts of the roster.
DC may be changing style as much as replacing value
DC’s net numbers look like a straightforward loss: the Breeze added 68.39 O-line aEC and lost 113.01. But their case is so interesting that i want to take an even deeper dive into the composition of this gap.
That incoming value is almost entirely Sean Mott, whose 2025 profile included 68.39 aEC, 16.40 aEC/100, 525 completions, and 1,022 touches. Against the outgoing total from Tyler Monroe, Thomas Edmonds, and Rowan McDonnell, Mott alone accounts for 60.5% of lost aEC, 56.2% of lost completions, and 53.0% of lost touches.
Another type of comparison is stylistic. Three additional metrics will help here:
-
xCP (expected completion percentage) estimates the difficulty of a thrower’s attempts based on field position, angle, and other contextual factors, expressed as a percentage. Lower xCP means the thrower is attempting harder throws on average.
-
CPOE (completion percentage over expectation) measures whether a thrower over- or underperforms relative to those expected completion rates, also expressed as a percentage.
-
HuAP% (huck attempt percentage) is the share of a thrower’s attempts that qualify as hucks. A higher HuAP% indicates a thrower who initiates deep shots more frequently.
The outgoing group’s weighted profile: xCP 95.5, CPOE −0.2, HuAP% 3.3%. Mott’s profile: xCP 94.4, CPOE +1.5, HuAP% 6.1%. Mott attempts harder throws on average, completes them at a rate above expectation, and throws deep roughly twice as often. Will the DC offense may become less distributed and more aggressive at initiating deep shots?
Another piece that makes this interesting is how DC gives such a huge completion load to Andrew Roy and Jacques Nissen. In 2025, they combined for 1,236 completions and 2,322 touches, roughly 35 percent of all O-line touches between just the two of them. This means Roy and Nissen are the players who keep possessions alive, absorb routine volume, and give DC a steady center of gravity underneath.
With both of them still on the roster for 2026, if Roy and Nissen continue to absorb the possession volume, DC may not need to recreate its lost usage piece for piece. It may just need Mott to change the shape of those possessions by choosing his moments to attack deep.
What the numbers say
The point of all this is that offseason movement is not just about net gain or net loss. It is about the shape of the value that moved and how hard that value will be to replace. That is what separates teams like Indianapolis and New York, which added offense in multiple forms, from teams like Toronto, Chicago, and Philadelphia, which now have to replace volume across multiple parts of the roster.
It is also what makes a team like DC more interesting than its raw numbers suggest. Sometimes turnover forces a rebuild, while other times it pushes a team toward a completely different style.
The only thing left now is to go out and play the games.
About Shown Space:
Shown Space is an analytics platform focused on bringing more depth and precision to ultimate frisbee. We combine data, modeling, and intuitive presentation to surface the patterns and choices that influence outcomes. If you want to learn more, you can visit shownspace.com, read more at the Shown Space Substack, or find the original Sloan paper, “A Machine Learning Approach to Throw Value Estimation in Professional Ultimate Frisbee”
